Note
Go to the end to download the full example code.
Two beams crossing in argon#
Two 800 nm, 40 fs pulsed beams of 0.2 mJ each and 150 um waist enter 1 bar of argon 0.8 mm apart, tilted 5 mrad towards each other, so that they cross 8 cm in and separate again by 16 cm. Where they overlap they interfere: fringes 80 um apart, lambda over twice the sine of the angle. Each beam alone is at about 0.6 of argon’s critical power for self-focusing, but in the bright fringes the intensity is up to four times one beam’s, and the Kerr effect focuses them.
The run is compared with the same crossing without the Kerr effect, which is the linear
superposition of the two beams that Two crossing beams in Cartesian free space
follows in vacuum. Here the launch is two SpatialPulse beams in
a SpatialPulseSum, which a recipe holds too:
Recipe.example("crossing_beams") is this run.
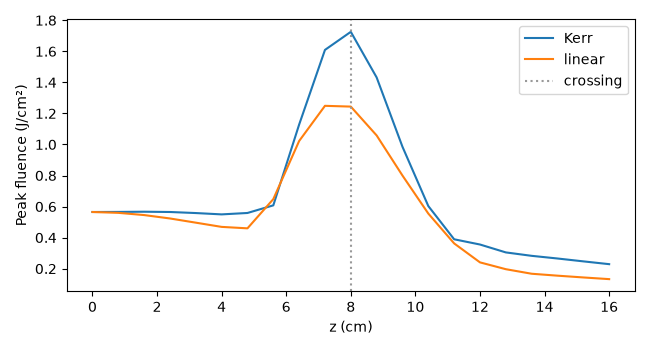
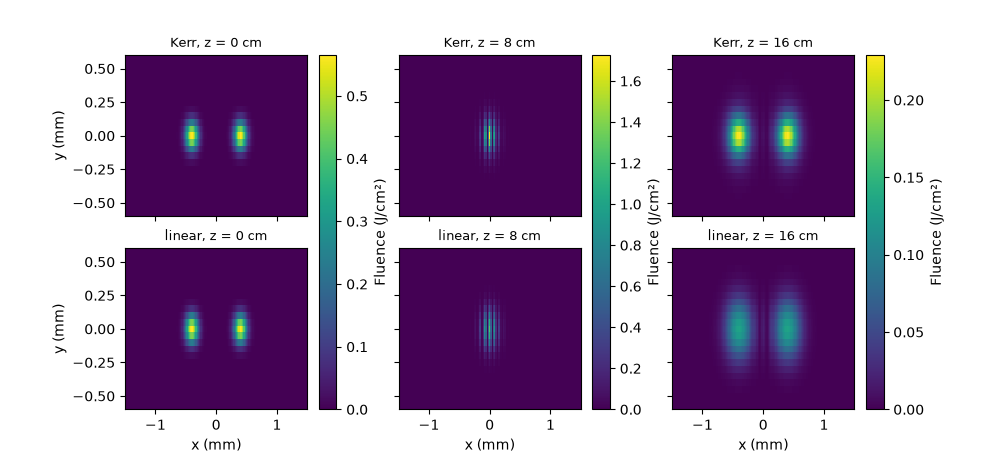
What to look for. At the crossing the fringes peak higher with the Kerr effect, and the beams leave it narrower and brighter than they entered it, with the fringes’ imprint between them; without it they cross and separate unchanged.
What is approximate. The Cartesian grid is reduced (192 by 40 nodes, a 200 fs window) to keep the run to seconds: it resolves each fringe with four nodes, and a little light scattered to the grid’s largest transverse wave numbers is removed and reported. No plasma is included: at these intensities argon’s ionisation is negligible, and a stronger crossing, whose fringes collapse into filaments, needs a much finer grid.
import time

import matplotlib.pyplot as plt
import numpy as np

from solprop.driver import SimulationSettings, prop_free
from solprop.grid import EnvelopeGrid, FreeGrid
from solprop.nonlinear.responses import KerrResponse
from solprop.physdata import gamma3
from solprop.processing.planes import fluence_map
from solprop.pulses import GaussianPulse, SpatialPulse, SpatialPulseSum
from solprop.spatial import SpatialMedium
from solprop.stats import StatsSpec
from solprop.stepper import PIController
The crossing#
Each beam starts 0.4 mm from the axis and is tilted 5 mrad towards it: their centres meet at 0.4 mm / tan(5 mrad) = 8 cm.
length = 0.16
grid = EnvelopeGrid.from_limits(length, 800e-9, (700e-9, 950e-9), 200e-15, thg=False)
space = FreeGrid(2e-3, 192, 1e-3, 40)
argon = SpatialMedium("Ar", pressure=1.0)
pulse = GaussianPulse(wavelength=800e-9, fwhm=40e-15, energy=0.2e-3)
beams = SpatialPulseSum(
    (
        SpatialPulse(pulse, 150e-6, displacement=(-0.4e-3, 0.0), tilt=(5e-3, 0.0)),
        SpatialPulse(pulse, 150e-6, displacement=(0.4e-3, 0.0), tilt=(-5e-3, 0.0)),
    )
)
settings = SimulationSettings(
    controller=PIController(rtol=1e-5, atol=1e-11),
    save_planes=[length * (index + 1) / 20 for index in range(20)],
    dz_init=1e-4,
    dz_max=2e-3,
    stats=StatsSpec(names=("energy", "peak_intensity")),
)
started = time.perf_counter()
kerr = prop_free(
    grid,
    space,
    argon,
    [KerrResponse(gamma3("Ar", wavelength=800e-9), thg=False)],
    beams,
    settings=settings,
    noise=None,
    progress="none",
)
linear = prop_free(
    grid, space, argon, [], beams, settings=settings, noise=None, progress="none"
)
print(f"Both runs in {time.perf_counter() - started:.1f} s")
BoundaryWarning: the safety ramp has removed 1.40e-06 of the launch energy above the input noise's share: content reached the grid's outer wavenumbers; refine the transverse grid (SEP 40 section 5.3)
Both runs in 5.6 s
The fluence at the launch, the crossing and the exit#
With the Kerr effect (top) and without it (bottom), on one colour scale per column.
planes = (0, 10, 20)
figure, axes = plt.subplots(2, 3, figsize=(10, 4.6), sharex=True, sharey=True)
for column, plane in enumerate(planes):
    maps = [fluence_map(run, plane) for run in (kerr, linear)]
    top = max(float(np.max(found.fluence)) for found in maps) / 1e4
    for row, (found, label) in enumerate(zip(maps, ("Kerr", "linear"), strict=True)):
        named = dict(zip(found.axis_names, found.axes, strict=True))
        x, y = np.asarray(named["x"]) * 1e3, np.asarray(named["y"]) * 1e3
        view = axes[row, column].pcolormesh(
            x, y, np.asarray(found.fluence) / 1e4, shading="auto", vmin=0, vmax=top
        )
        axes[row, column].set_title(f"{label}, z = {found.z * 100:.0f} cm", fontsize=9)
    figure.colorbar(view, ax=axes[:, column], label="Fluence (J/cm²)")
for axis in axes[-1]:
    axis.set_xlabel("x (mm)")
for axis in axes[:, 0]:
    axis.set_ylabel("y (mm)")
axes[0, 0].set_xlim(-1.5, 1.5)
axes[0, 0].set_ylim(-0.6, 0.6)
(-0.6, 0.6)
The peak fluence along z#
The Kerr effect raises the fringes’ peak at the crossing, and the beams keep the focusing they gained there as they separate.
figure, axis = plt.subplots(figsize=(6.5, 3.5))
for run, label in ((kerr, "Kerr"), (linear, "linear")):
    peaks = [
        float(np.max(fluence_map(run, plane).fluence)) / 1e4
        for plane in range(run.n_saved)
    ]
    z = [fluence_map(run, plane).z * 100 for plane in range(run.n_saved)]
    axis.plot(z, peaks, label=label)
axis.axvline(8.0, color="0.6", linestyle=":", label="crossing")
axis.set(xlabel="z (cm)", ylabel="Peak fluence (J/cm²)")
axis.legend()
figure.tight_layout()